

Stanford Graduate School of Business released the 2026 Search Fund Study on 30 June, five days before this issue landed in your inbox. It is the most authoritative biennial data on search fund activity, covering 862 core funds tracked since 1984 and, for the first time, 67 Long Duration Enterprises (LDEs) as a distinct category.
Read against the IESE 2024 International Search Funds Study, the two studies have moved apart in ways that matter for European searchers building a thesis in 2026.
The 2024 comparison told a story of convergence: similar acquisition rates across geographies, comparable difficulty, differences mostly in returns. The 2026 story is different. The acquisition rate has flipped in the direction most readers do not expect. The LOI dynamics now come with Stanford-published reasons for why deals fail. And a whole new category (LDEs) has emerged that maps directly to the model European searchers of my generation are quietly moving toward.
This issue is the side-by-side read. Six divergences, one new category, and what all of it means for a European searcher this week.
A brief on the two studies
Stanford 2026 Search Fund Study. Released 30 June 2026 by the Stanford GSB Grousbeck-Holloway Center for Entrepreneurial Studies. Covers 862 core search funds started in the United States and Canada between 1984 and December 2025. Captured outcomes for 97 percent of known funds. Introduces a new category: 67 Long Duration Enterprises. Published biennially since 1996. Free to download.
IESE 2024 International Search Funds Study. Published by IESE Business School in Barcelona, the international companion to Stanford. Covers 320 international (non US/Canada) search funds through 2024. The most credible reference for European searchers because the geographic scope matches the audience’s reality. The next IESE update is expected but not yet released.
The two studies are, by design, complementary. Stanford covers US and Canada. IESE covers everywhere else. Read together, they are the closest thing the field has to a full picture of global search fund activity.
Six things have moved since the 2024 comparison. One new thing has appeared.
1. The acquisition rate has flipped, and Spain is far ahead of the rest of Europe
This is the most important single change in the 2026 data.
Stanford 2026: overall acquisition rate for all concluded search funds is 58 percent, down from 63 percent in the 2024 study. For funds that started 2021-24, the rate is 48 percent. Roughly half of recent US and Canada searchers acquired a company.
IESE 2024: 72 percent of concluded international searches made an acquisition. Meaningfully higher than the US number, both in the recent cohort and in the overall study.
The direction of the divergence surprised me on first read. In 2024, the two studies converged around a 63 to 66 percent acquisition rate. In 2026, they have moved apart, and the international rate is now higher.
Stanford is direct about why the US number has dropped. Two factors: less favourable US market conditions with increased competition, and a wider range of preparedness among entrepreneurs as search funds have grown more popular. Controlling for MBA-program preparation, they found that roughly half of the decline is market-driven.
The European picture is more textured than the international average suggests.
The 2026 data shows European acquisitions clustered in a few countries with a wide gap between the leader and the rest:
Spain: 59 acquisitions
United Kingdom: 17
France, Germany, Italy: 15 each
Poland, Netherlands: 5 each
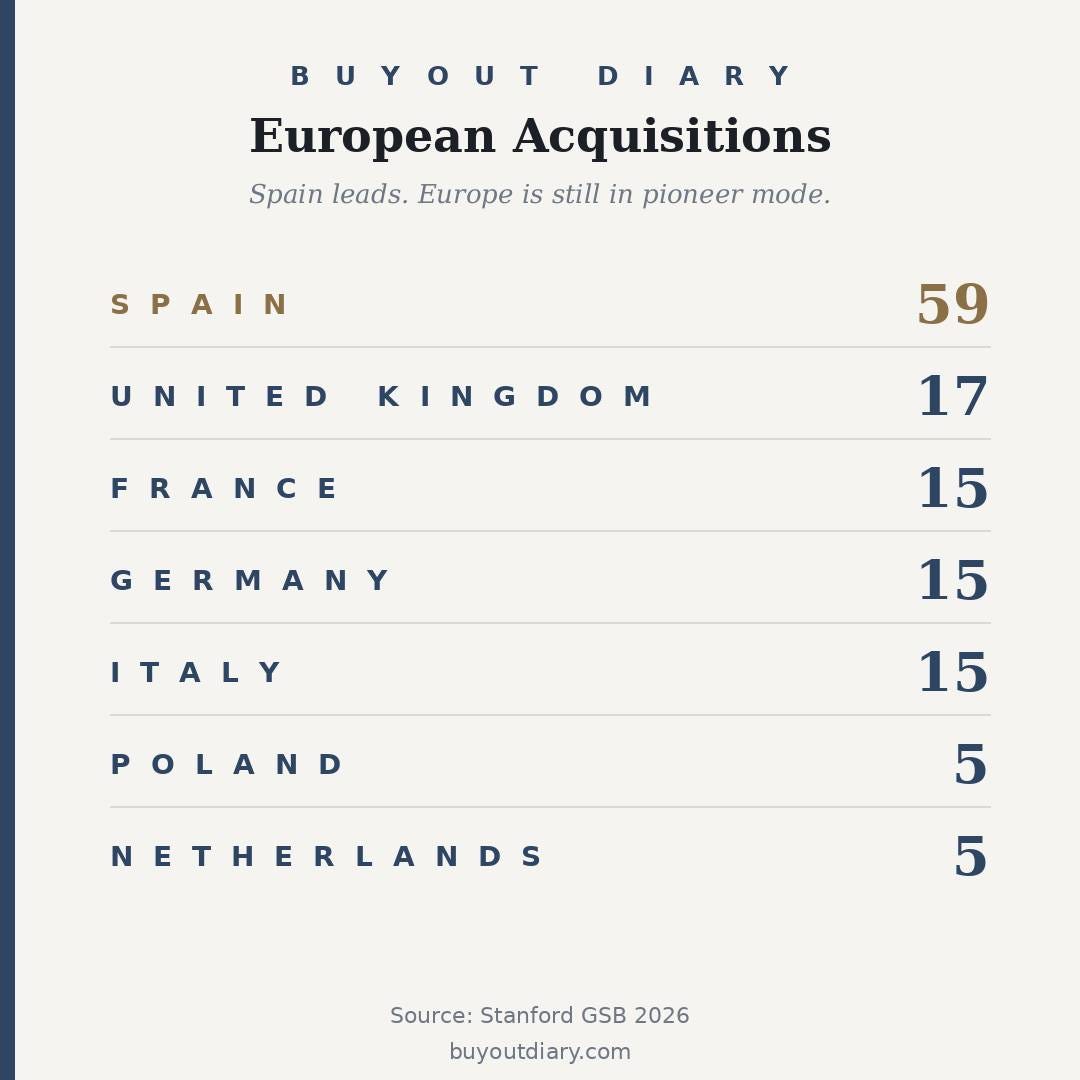
Spain is not just leading. Spain is at a fundamentally different maturity level from the rest of Europe. The country has built a mature ETA ecosystem over the past decade through universities running formal ETA tracks (IESE Barcelona chief among them) and policy attention to succession as economic infrastructure. Every other European country is at least five years behind. The Netherlands, where I live and search, is at five acquisitions in the data. Poland is at the same number. Germany, France, and Italy are clustered at fifteen. The United Kingdom is at seventeen.
The editorial reading is important for how a European searcher should think about 2026.
The American search fund model is entering a more competitive phase in its home market. More searchers, similar deals, tighter economics. The European market is in a fundamentally different position: still fragmented, still culturally and linguistically local, still regulatorily distinct country by country. This fragmentation is often described as a weakness (harder to build a pan-European practice) but the 2026 data suggests it is closer to a feature than a bug. Fragmentation means less crowding. Less crowding means the acquisition math still works for the searcher who focuses on one country, one culture, one regulatory framework.
If you are a European searcher building a thesis for the next twelve months, the 2026 numbers are not just permission to proceed. They are a signal that the window is open now, and that the specific country you focus on matters more than the general “European” positioning.
The succession gap is still there. The American market is contracting. The European market has not yet grown into its opportunity. Do not worry about competition. Focus on the country and the sector where your credibility is closest.
2. The LOI dynamics, and what Stanford now says about why deals break
Two weeks ago I published an issue on why LOIs break even when diligence is clean. It proposed a four-pattern model: emotional, operational, structural, financial. The piece was built on my own two broken LOIs, a reader question from Veena Giridhar Gopal at New Chapter Capital, and the S&P Global research on deal cancellation drivers.
The 2026 Stanford Study now provides direct data on why LOIs fail. The numbers validate the four-pattern reading.
Stanford 2026 on LOI dynamics:
Searchers who acquired in 2024-25 signed 2.5 LOIs on average
First LOI signed 7 months into the search
Down from 3.6 LOIs in the 2024 study (a shift worth noting)
Stanford 2026 on why LOIs fail:
Discovery in due diligence: 79 percent
Valuation differences with the seller: 45 percent
Lack of investor support: 40 percent
The mapping onto the four-pattern model from the LOI break piece is close to direct.
Discovery in due diligence (79 percent) maps to Pattern 2, operational reality. This was the pattern that broke both of my own LOIs. Founder dependency, customer concentration, the gap between what diligence reveals on paper and what shows up in the day-to-day of the business.
Valuation differences with the seller (45 percent) map to Pattern 1, emotional drift. The seller who quietly raises their price during diligence, the seller who reconsiders after seeing the number in writing, the seller whose spouse or advisor has weighed in. Valuation as a category is often emotional drift disguised as a number.
Lack of investor support (40 percent) maps directly to Pattern 3, structural pressure on the buyer side. The investor who drops out late, the committee that adds conditions, the equity gap that opens in the last two weeks and cannot be closed.
Pattern 4, the financing layer, is folded into the discovery and investor support numbers. Working capital adjustments and seller notes surface during diligence. Bank and lender conditions land during investor support. Stanford does not break these out separately, but the pattern is there.
The four-pattern model I proposed in Issue 5 now has Stanford’s biennial dataset behind it. That is what validation looks like. If you have not read the LOI break piece, here it is. If you have, the 2026 numbers give you the data support for using the model in your own diligence process from this week forward.
One more note on LOI counts. The IESE international number is approximately four LOIs to close. The Stanford 2026 number of 2.5 is specifically for recent acquirers, not the aggregate. What both numbers confirm: closing takes multiple LOIs almost everywhere. If you have broken one or two, you are on schedule, not behind it.
3. The returns gap has narrowed but remains real
The largest single divergence between the two studies. Slightly smaller than it was in 2024, still meaningful in 2026.
Stanford 2026:
Aggregate IRR: 33.9 percent, down from 35.1 percent
Aggregate ROI: 4.75x, up from 4.5x
Stanford notes ROI rose “because CEOs held companies longer”
Exited funds only: 39.3 percent IRR, 5.98x ROI
PME (vs S&P 500): 2.88 overall, 3.59 for exited funds
IESE 2024 international:
Aggregate IRR: 18.1 percent
Aggregate ROI: 2.0x
The 15-point IRR gap is not what it looks like at first read.
Stanford itself provides the key caveat. Search fund returns follow a power law. A small number of investments substantially outperform the rest and drive a large part of overall returns. Excluding funds returning 10x or more drops the aggregate ROI from 4.75x to 2.8x and IRR from 33.9 percent to 27 percent. Excluding the top 10 percent of funds drops ROI to 2.1x and IRR to 20 percent.
The honest reading: the American search fund headline returns are elevated by a small number of very old, very successful funds. The underlying more recent cohort returns are much closer to what IESE reports for international. The gap will likely narrow further as European and international cohorts mature, because 62 percent of IESE-tracked international acquisitions happened after 2020 and have not yet had time to compound.
The correct framing for a European searcher or investor is not “European search fund returns are lower than American.” The correct framing is that the American headline number is not the benchmark that applies to any cohort acquired in the last five years, and the European baseline is closer to the current American reality than to the American historical outlier.
4. Cohort maturity, and the shape of the two markets
Stanford 2026: the American search fund ecosystem is now mature. Multi-decade cohorts. Acquisitions peaked in 2021 and declined year over year through 2024, with a modest uptick in 2025.
IESE 2024: 62 percent of tracked international acquisitions happened after 2020. The international asset class is structurally young.
The maturity divergence is the single most important structural fact about European ETA in 2026, and reading the two studies together makes it visible.
The American market is at the top of its curve and slightly contracting. The European market is at the bottom of its curve and rising. That is not a value judgement about either market. It is a description of where each one sits in the cycle.
For a European searcher this means two things. First, the American search fund infrastructure (cohort programmes, investor networks, mature advisor relationships) is not yet available in Europe at the same depth. That is genuinely harder. Second, the American competitive dynamics (crowded deals, tighter economics, wider preparedness range dragging down median outcomes) are not yet present in Europe either. That is genuinely easier.
The window that European ETA has in 2026 is the window between “no infrastructure” and “too much competition.” That window will not stay open forever. The IESE 2024 data suggests it is open now.
5. Sector concentration is different, and shaped by what is actually available
Stanford 2026: services remained the most popular acquired sector, followed by software. Education (credentialing and vocational training) had its highest-ever number of acquisitions. Tech-enabled services and healthcare remained popular.
IESE 2024 international: sector distribution leans toward traditional industries, services, and manufacturing.
The sector divergence partly reflects what is available to acquire. European SME ownership is concentrated in industries where the American market has consolidated faster: software, tech-enabled services, healthcare platforms. What remains available in Europe leans traditional. Manufacturing, distribution, trades, professional services, education, and increasingly, industrial services.
This is not a limitation. It is a description of the shape European ETA will take for the next decade. Traditional industry consolidation rather than platform consolidation. Different economics, different exit paths, different capital structures. The searchers who understand that the European ETA business is closer to traditional buy-and-build than to Silicon Valley platform building will build the right thesis. The searchers who transplant the American playbook will struggle.
One data point from Stanford 2026 worth watching: education (credentialing and vocational training) had its highest-ever US number in 2024-25. This category is also at the centre of the European succession wave in vocational training and Handwerk-adjacent education. Worth watching.
6. Long Duration Enterprises are the most consequential new category in years
Stanford has introduced 67 tracked Long Duration Enterprises (LDEs) as a distinct category for the first time in 2026. This is the most important addition to the study in a decade, and the one with the most direct implications for European ETA.
I published a LinkedIn carousel on the LDE model last Friday breaking down the architecture visually. The reactions there suggest the model is landing with European searchers even if the language is still new. If you have not seen it yet, worth a look before continuing.
What LDEs are, per Stanford:
Committed capital vehicles raising a pool of capital upfront, typically $10 to $25 million
Longer planned duration: 10+ years vs 5-7 for core search funds
Focus on multiple acquisitions and building a portfolio
Explicit investment thesis, often deeply researched
Active board oversight from inception
Path to “flywheel” where growth is funded through operating cash flow and leverage, not future equity raises
Stanford 2026 LDE data:
67 tracked LDEs in the US and Canada
63 percent launched in 2024 or later
Of LDEs formed in 2023 or earlier, 96 percent acquired one or more companies
No LDE has closed without an acquisition
Six LDEs have already achieved flywheel
LDE founder differences from core search:
Less likely to have an MBA (70 percent vs 80 percent)
MBAs graduated longer ago (median 2 years vs 0 years)
Much more likely to have a cofounder (52 percent vs 27 percent)
Committed capital raised: median $20 million from 17 investors over 4 months
Reading the LDE data carefully, this is the model that maps most closely to what a growing number of European searchers are quietly moving toward. Independent sponsor, HoldCo, buy-and-build. Different names in different countries. The same underlying architecture.
The value of Stanford naming the category is that a European searcher who has been positioning between self-funded search and independent sponsor now has a Stanford-validated framework to reference in investor conversations. You can cite it in a way you could not last year. That matters more than the specific data points.
Where I think this lands for Europe, specifically for Germany and similar cultures.
The traditional search fund model has struggled to gain deep traction in Germany. Investors familiar with Mittelstand acquisition dynamics have been reluctant to fund a searcher who has not yet identified a target. The model asks the investor to commit capital to a vehicle that is essentially a search, not a business.
The LDE model asks the investor to commit capital differently: to a thesis, a founder or founding team, and a defined portfolio ambition. Higher initial ticket, higher initial commitment on both sides. The investor is not funding a search, the investor is funding a portfolio strategy. The searcher is not looking for a business, the searcher is executing a plan.
This is closer to how German (and Dutch, Swiss, French) family offices and Mittelstand investors already think about capital deployment. It fits the culture better. It fits the investor psychology better. And it fits the more experienced European searcher, who often comes from operating rather than MBA backgrounds and wants a longer-duration structure than a five-year search fund provides.
The 96 percent acquisition rate among older LDEs is worth sitting with. It is much higher than the 58 percent core search fund rate. Part of that is smaller initial targets (the first LDE acquisition is often a platform deal, not the whole thesis). Part of it is committed capital, which cannot walk away. Part of it is founder preparation, since LDE founders spend longer researching before raising.
For any European searcher, investor, or operator reading this: the LDE category is now the most important architectural question in ETA. Read the Stanford pages carefully (15 through 17 of the study, plus Exhibits 9 through 11). This is where the next decade of European ETA is likely to be shaped.
7. New countries, and the shape of the international map
Stanford 2026 on international activity:
190 new core search funds launched outside US and Canada in 2024-25
503 known international funds total
72 percent acquisition rate among concluded international searches
77 new international acquisitions in 2024-25
New countries launching searches in 2024-25: Malaysia, Norway, Saudi Arabia, Singapore, Taiwan, Thailand, Turkey, Uruguay.
First acquisitions in 2024-25: South Africa, Austria, India.
Two European additions worth noting. Norway is now launching searches. Turkey is now launching searches. Both suggest the European (or European-adjacent) search fund geography is expanding, not consolidating. Austria had its first acquisition in this cycle.
The map is getting wider, not narrower. That is another signal that European ETA in 2026 is at the beginning of its curve, not the end.
What this all means
The 2026 update has made the two markets more clearly distinct than the 2024 comparison did.
European ETA in 2026 is a structurally young asset class, on the rising side of its curve, with a Stanford-published portfolio-model framework (LDEs) that maps to what European searchers are quietly building. The window between “no infrastructure” and “too much competition” is open now. Spain has demonstrated that a mature European ETA ecosystem is possible. Every other European country is at least five years behind Spain and has room to build.
American search fund activity in 2026 is a mature asset class, on the slightly contracting side of its curve, with tighter deal economics, wider preparedness variance, and lower recent-cohort acquisition rates. The headline returns are elevated by historical outliers, and the current cohort economics are closer to European reality than to the American historical average.
The two studies together give the European searcher the calibration to plan honestly. Reading only one study produces the wrong thesis in 2026.
What you can do this week
Three actions scaled by ambition.
Smallest step. Read both studies. The Stanford 2026 Search Fund Study and the IESE 2024 International Search Funds Study are both publicly accessible and free to download. Two hours of reading. The highest-leverage research action a serious European searcher can take in 2026.
Bigger step. Take three numbers from each study that you are using as benchmarks in your own thesis. Cross-check them against the other study. If they only appear in one, flag them. If they appear in both with different values, decide which one you are using and why. Pay specific attention to whether your thesis is anchored on the 2024 Stanford numbers, which are now outdated in several material dimensions.
Boldest step. Build the LDE construct into your investor and operator conversations. Stanford has now published a framework for the model many European searchers are quietly moving toward. The searchers who name their model in Stanford’s language will have an easier time raising capital, hiring operators, and building credibility with investors in 2026 and 2027 than the searchers who still describe themselves in traditional search fund terms.
Close
The 2026 update is not a small refresh of the 2024 numbers. It is a genuine editorial event for anyone thinking seriously about ETA in Europe. The two markets have diverged. The LDE framework has been named. The country-by-country picture inside Europe is now visible. And the specific reasons LOIs fail are now published in a way that maps directly onto the model I proposed six weeks ago in the LOI break piece.
I will keep reading these studies as they release. When the IESE 2026 update lands, this piece will be revisited.
If you are reshaping your own thesis based on the 2026 numbers, reply and tell me which single number or observation is doing the most work. The cross-checks become the next iteration of this piece.
See you next Monday.
Alexander